This announcement was made at Google Cloud Next ‘22. Visit the Cloud Blog to learn more about the latest Google Workspace innovations for the ever-changing world of work.
What’s changing
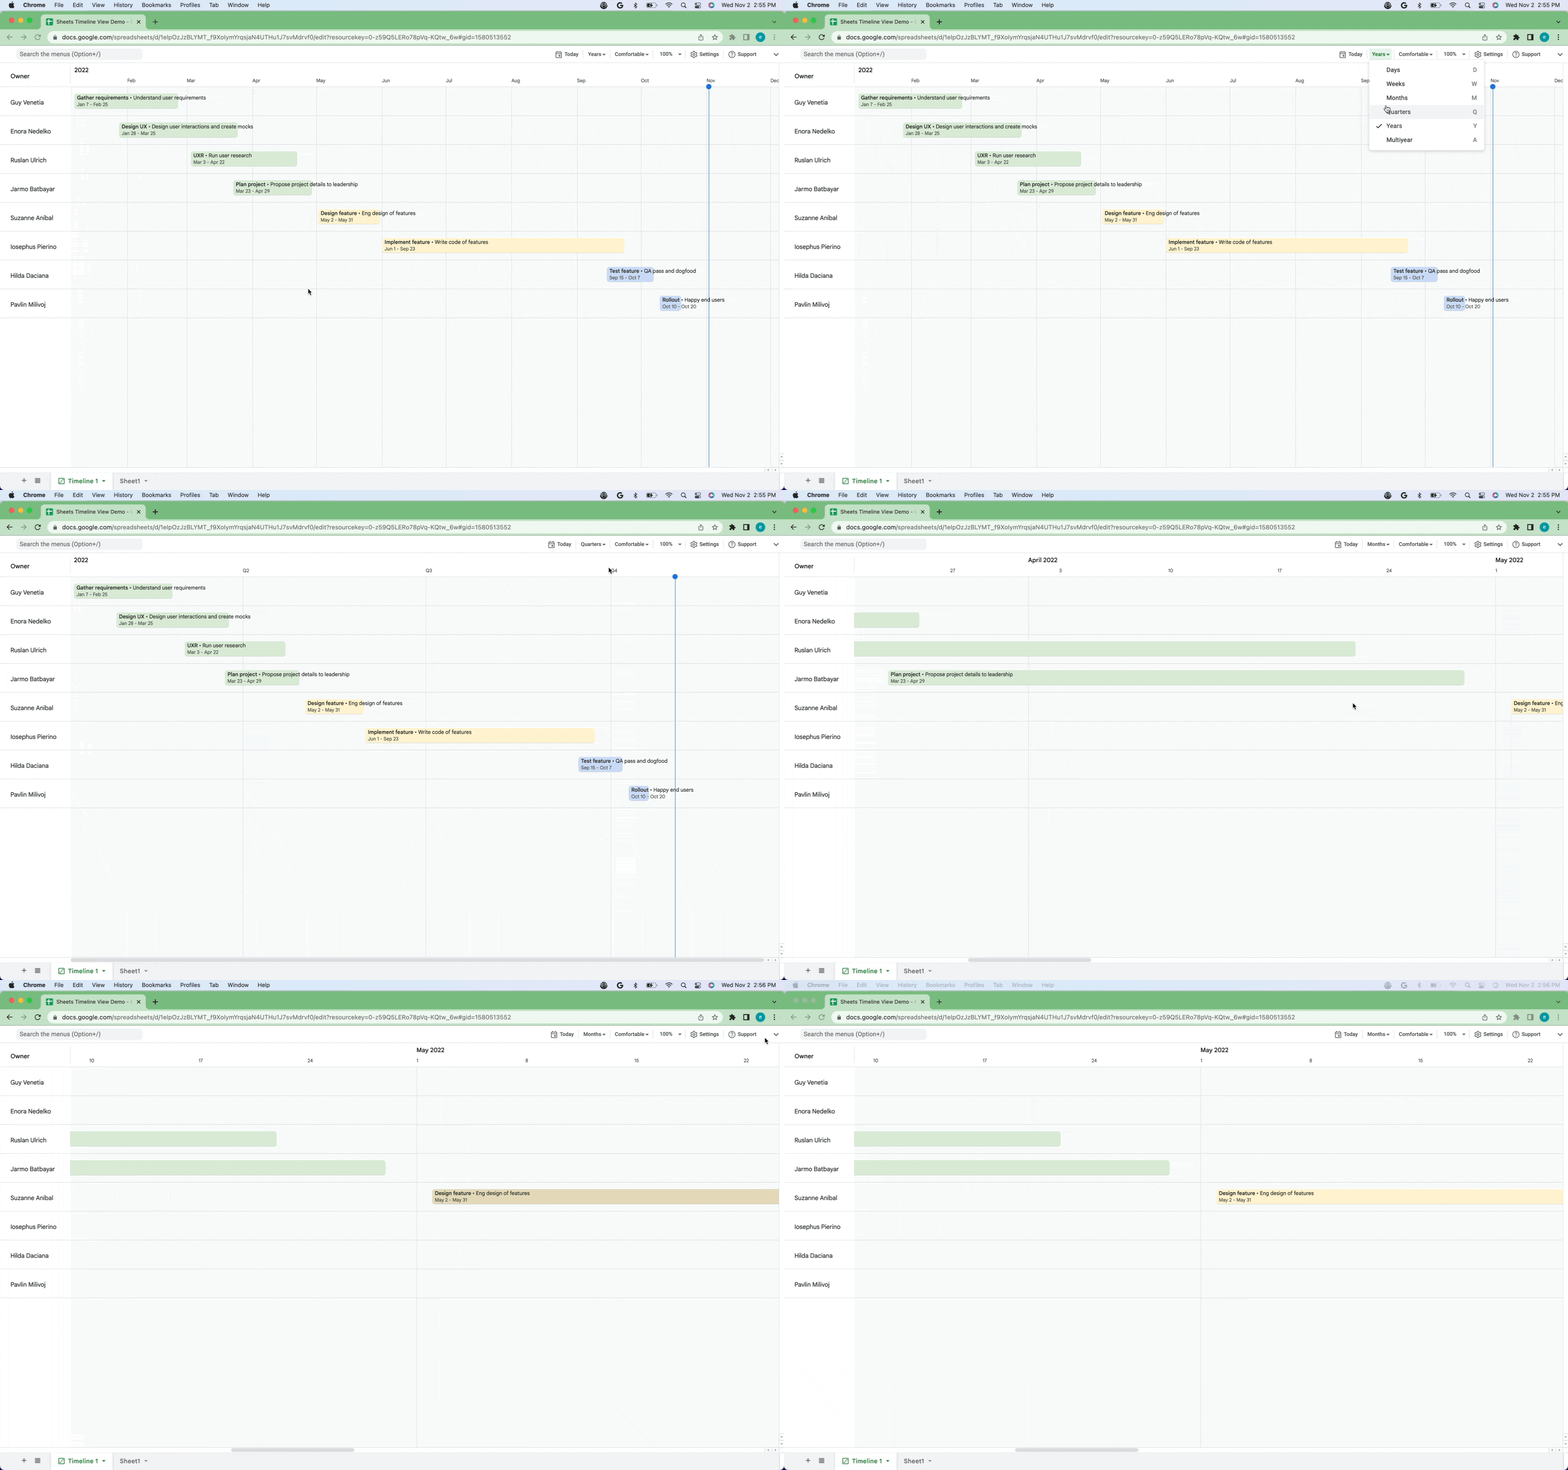
To extend the power of smart canvas, we’re introducing an interactive Timeline View that allows you to track projects in Google Sheets. This new visual layer displays project information stored in Sheets, such as the task start and end date, description, and owner.
Who’s impacted
End users
Why you’d use it
The Timeline View enables you to easily interact with project information and can help you manage things like marketing campaigns, project milestones, schedules, cross-team collaboration, and more.
Additional details
By clicking on a card within the Timeline, you can view more information about the project in the sidebar. You can also view your Timeline at various time intervals (day, week, month, quarters, year, and multiyear).
Getting started
- Admins: There is no admin control for this feature.
- End users: To create a Timeline, navigate to Insert > Timeline > select a data range > configure the attributes in the timeline settings sidebar. Once created, you can view the Timeline at different time intervals, jump to the current date, change the visual appearance of the Timeline by adjusting spacing or using colors, and more. Visit the Help Center to learn more about Timeline View.
Rollout pace
- Rapid Release domains: Gradual rollout (up to 15 days for feature visibility) starting on November 2, 2022
- Scheduled Release domains: Gradual rollout (up to 15 days for feature visibility) starting on November 16, 2022
Availability
- Available to Google Workspace Essentials, Business Standard, Business Plus, Enterprise Essentials, Enterprise Standard, Enterprise Plus, Education Fundamentals, Education Plus, Education Standard, the Teaching and Learning Upgrade, and Nonprofits customers
- Not available to legacy G Suite Basic and Business customers
- Not available to users with personal Google Accounts
Resources
Roadmap
- This feature was listed as an upcoming release.

